Many European industrial companies are currently navigating a challenging environment: production volumes remain soft, input costs continue to fluctuate and competitive pressure remains high. Even where revenue has remained stable, margins often show gradual erosion.
In many cases, this margin pressure is not caused by a single strategic mistake but by limited visibility into where pricing power actually exists and how consistently it is executed across customers, products and regions. Without that transparency, companies struggle to react quickly to market shifts, cost changes or competitive moves.
A structured pricing diagnostic can often reveal where pricing power still exists and where margins are leaking, providing a clear starting point for targeted commercial improvements.
Industrial sentiment remains cautious across Europe
Production is soft, costs stay volatile – and even where revenue has held up, many firms see margins slipping.
Where pricing power often leaks in industrial B2B
That pattern shows up again and again, not because teams aren’t working hard, but because pricing power is no longer fully visible or consistently executed.
In most industrial organizations, margin erosion concentrates in a few places:
– Discounting without clear guardrails
– Premium and tail SKUs priced without logic
– Cost and tariff increases passing through too slowly
– Sales negotiating without deal-level visibility
– CRM data disconnected from what actually hits the P&L
Leadership often suspects this, yet lacks a fast way to make it concrete and actionable.
A practical two-step approach
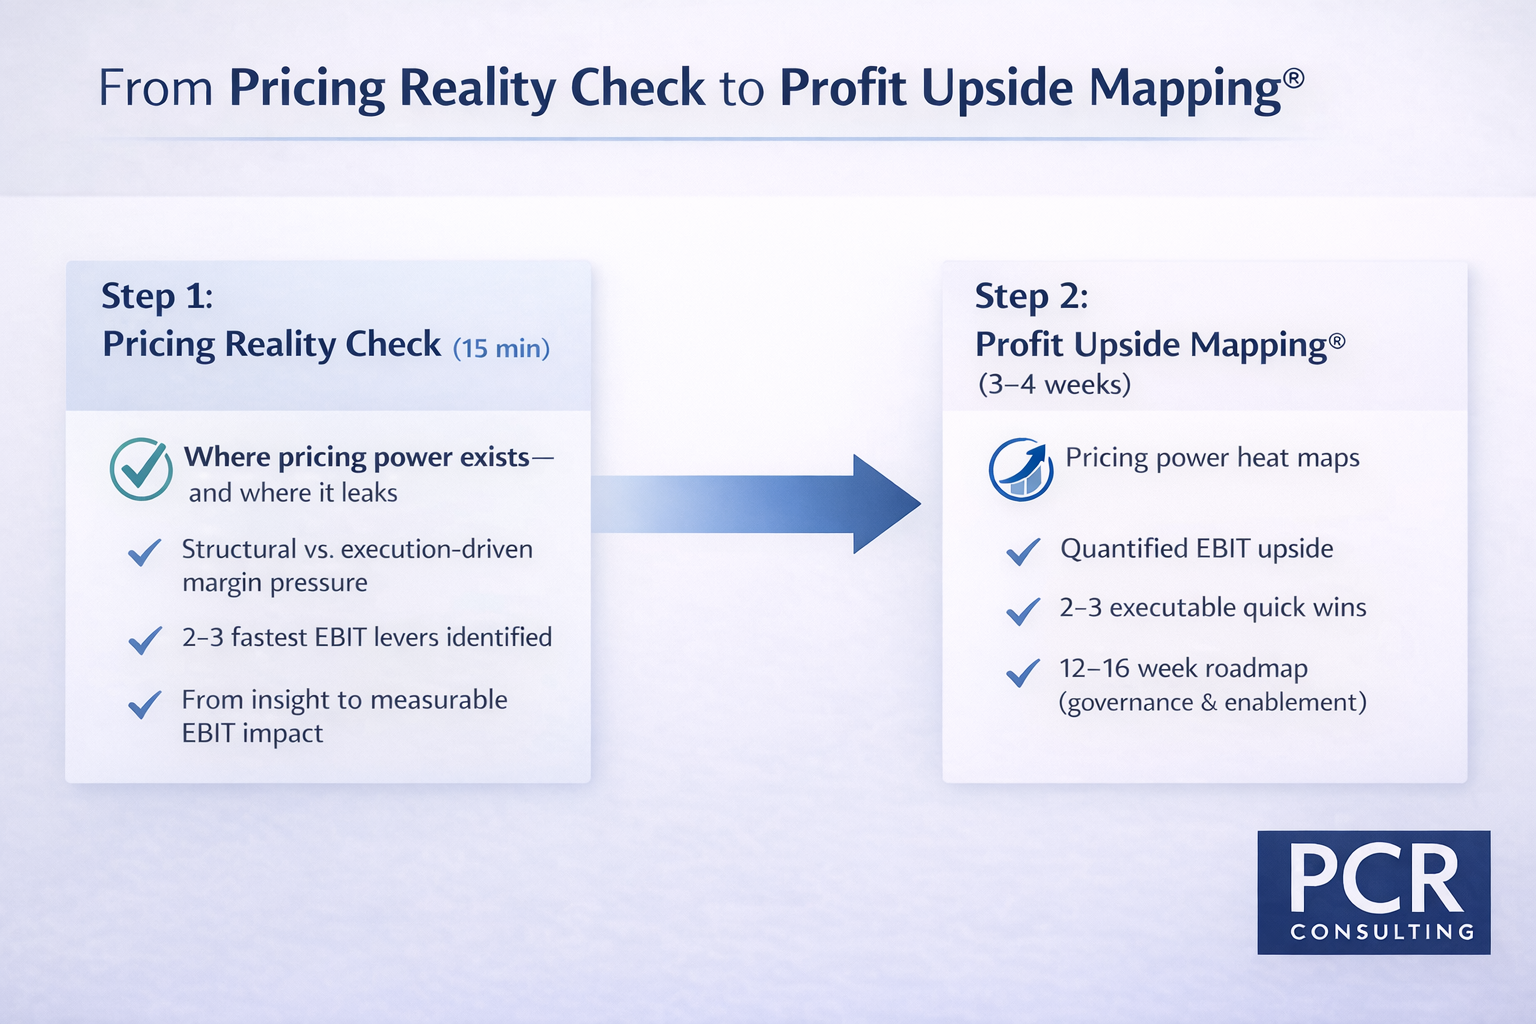
Step 1: The Pricing Reality Check
That’s why I built a 15-minute Pricing Reality Check, a short self-assessment that helps clarify
– where pricing power still exists and where it’s leaking
– whether margin pressure is structural or execution-driven
– which 2–3 levers could move EBIT fastest in the next 90 days.
For many industrial companies, this already points to 1–3 points of recoverable margin.
What happens next depends on appetite.
Some teams want to take immediate action on a concrete pricing decision. Others prefer to dig deeper into where pricing power really sits before acting.
Step 2: Profit Upside Mapping®
For companies ready to scale impact, Profit Upside Mapping® (PUM) is the next step. A focused 3–4-week diagnostic that turns those signals into action:
– Pricing power heat maps by customer, product, region
– Quantified EBIT upside ranges
– 2–3 concrete quick wins executable within weeks
– A 12–16-week tactical roadmap incl. governance and sales enablement.
Recent clients recovered ~1.5 pts EBIT within a quarter, without major system changes or customer losses.
Key takeaway
Margin pressure in industrial companies often reflects limited visibility into where pricing power exists and how it is executed.
Structured pricing diagnostics, starting with a quick reality check and followed by deeper analysis, can make these profit leaks visible and quantify where meaningful EBIT improvements can be captured within a short time frame.
Would you like clarity on where pricing power still exists and where margin is leaking?
Text me. I’ll share the Pricing Reality Check, and, if useful, explain the most sensible next step for your situation.